Experience Our Biggest Web App Update with 5,000+ New Genres! 🎉 Discover Now

From Data to Decision – How to Use Music Data and Analytics for Intelligent Decision Making

From Data to Decision – How to Use Music Data and Analytics for Intelligent Decision Making

We continue writing about the Data Pyramid and in this article we finalize the series with an overview of the fourth level of the pyramid – Intelligence. The supreme discipline of data utilization and a path to success when done right.

Other articles in the series include: 

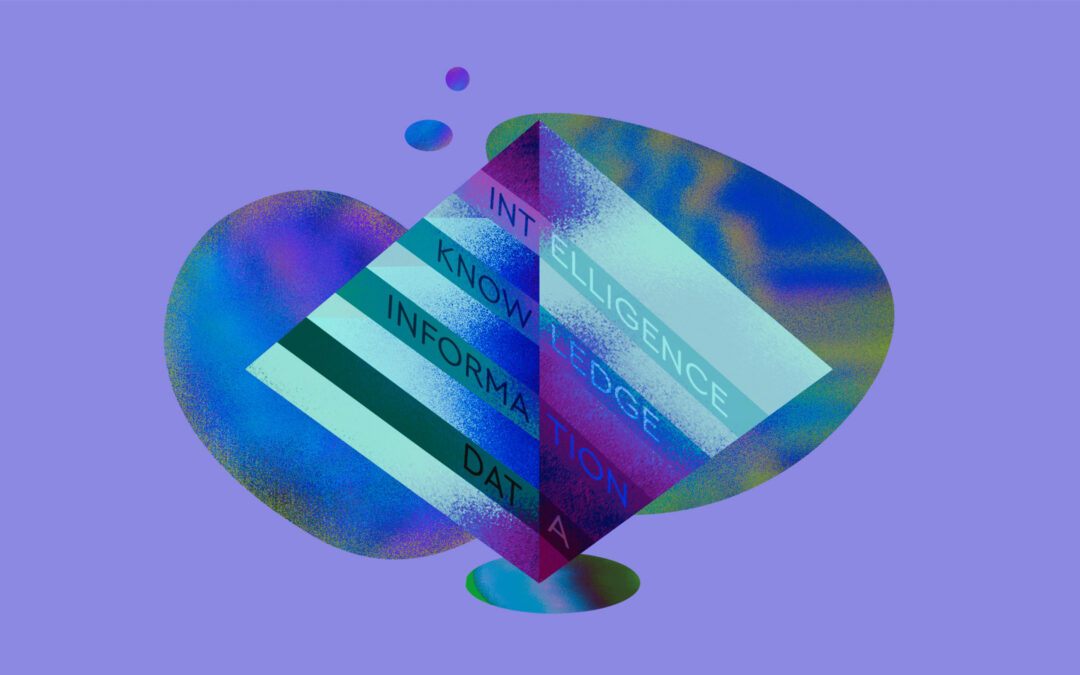
How to Turn Music Data into Actionable Insights: This is an overview of the Data Pyramid and how it can be used in the music industry. 

An Overview of Data in The Music Industry: This article gives a list of all types of metadata in the music industry.

Making Sense of Music Data – Data Visualizations: This article explores data visualizations as the second step of the pyramid and gives examples of visualizations in the music industry. 

Benchmarking in the Music Industry – Knowledge Layer of the Data Pyramid: This article deals with Knowledge and how it is used to benchmark performance and set expectations.

Data Pyramid and the Intelligence Layer
The Intelligence layer of the pyramid deals with the future and answers questions “So What?” or “Now What?”. When this level is reached, usually the company stakeholders already have the dataset that is organized and structured as well as information about past outcomes of decision making. They also must have access to real-time data to learn and adjust on the fly. Having all the information at hand enables them to anticipate the outcomes of future decisions and choose the most suitable course of action.

Intelligence can be described as the ability to choose one decision out of a million other decisions based on knowledge of how these decisions might affect the outcome. 

Intelligence can be generated by the machine, for example, a self-driving car is a form of intelligence that scans the environment and can predict the course of action for the next section of the road. In the music industry, intelligent decisions are still, for the most part, made by humans by examining information, reading graphs and charts, memorizing past outcomes, and monitoring real-time data. In this article, we’ll explore some of the emerging intelligence technology in the music field so keep reading to find out more.

Prescriptive, not Predictive Analytics
Intelligence in data science is produced by the use of prescriptive analytics, which is the process of using data to determine the best possible course of action. Prescriptive analytics often employ machine learning algorithms to analyze data and consider all the “if” and “else” scenarios. Multiple datasets over different periods of time can be combined in prescriptive analytics to account for various scenarios and model complex situations. 
Intelligence Layer – Examples in the Music Industry

1. Recommendation systems that learn and adapt effectively to individual users’ preferences

Recommendation systems already use some sort of prescriptive analytics when they make a selection of songs based on past user behavior. Recommendation systems can also take into account the sequence of songs and context that affect the enjoyment level of the playlist as a whole. As previously played songs influence the perception of the next song, the playlist can be adjusted accordingly. The ability to prescribe a listening experience by recommendation systems is, perhaps, the most common and well-developed example of intelligence in the music industry.

Additionally, recommendation systems can prescribe music that directly affects user behavior. This project, for example, uses data from running exercises, predicts the future running performance, and recommends songs that maximize running results. It does so continuously, as the system stores and learns from each updated running exercise record.

To learn more about different types of recommendation systems, check out the article How Do AI Music Recommendation Systems Work. 

Photo at Unsplash @skabrera

2. Automatic playlist generation based on context

Generating music or suggesting existing music based on the context is an analog of a self-driving car in the music industry. The music adapts to the listening situation to amplify the current experience. For instance in video games, where music adjusts to the plot as the user progresses through various levels of the game. More on that in our article on Omniphony engine that explores adaptive soundtracks and music context in game development.

Such systems are also used as location-aware music recommendations for travel destinations (when music is chosen based on the sightseeing place you visit), or computer vision systems for museum experiences (when the artwork dictates the audio choice). In these cases, the constantly changing environment serves as the basis for recommendations. 

Another example of intelligence in this field is generating music in the metaverse which is a virtual environment, that includes augmented reality. The metaverse can be accessed through Oculus headsets and a smartphone. Currently, virtual streams and concerts are already conducted in the metaverse, so it is only a matter of time till the curated immersive experiences that can adjust to the audience’s needs will be delivered using intelligence.

3. Prescriptive curatorship – What’s going to be hot next? 

Prescriptive curatorship entails an understanding of how up-and-coming artists and tracks will perform and who is more likely to break in the near future. In the past, platforms like Hype Machine indexed music sites and helped find the best new music. 

Nowadays, there are systems that can predict future hits and breaking artists automatically. For example, Spotify is developing algorithms that can predict future-breaking artists. The algorithm takes into account the preferences of the early adopters and then determines whether the artist can be considered breaking. This data can then be used to sign deals with the artist at a very early stage.

Photo at Unsplash @jhjowen

4. Tracking changes in music preference distribution  – making music that hits the current preferences or even future preferences

Unlike prescriptive curatorship that relies on a group of experts, music preference distribution numbers serve artists to show how their chosen genre and formats fit audience demographics and how music can be changed for current or future preferences. The general consensus in the music industry is that music preference algorithms come after the music is produced, otherwise all music will end up sounding the same to mimic popular artists. 

There is not yet a system that would automatically recommend changing the content of the song based on what users prefer. Nevertheless, attempts to use the numbers to create songs people will like are still being made.

5. Royalty Advances

Royalty advances are a complex task that requires comprehensive tracking of music consumption across all platforms. Distributors such as Amuse and iGroove offer a royalty advance service that is able to predict upcoming payout amounts so that artists can invest in their music long before the actual royalties kick in. These systems analyze streaming data to calculate upcoming earnings. 

Recently the topic got even more attention through the hype of NFTs. Crypto-investors want to predict future royalty payouts and the value of their asset. 

Future platforms most likely will be able to prescribe a course of action regarding which distribution platform to focus on based on the predicted royalty amounts. 

Conclusion
True intelligence in music is still hard to come by. Most of the technology described in this article falls in the space between Knowledge engines, that make predictions, and Intelligence machines, that prescribe the most appropriate course of action out of million other possible actions.

The main concern in the industry is how far can one go with technological intelligence considering that music is a creative activity and the human element is still largely prevalent. An intelligence machine that can tell which music to produce based on a prediction of future user preferences generally prompts an adverse reaction in the industry. 

Nevertheless, intelligent decisions to adjust the content of songs or to sign future-breaking artists identified by the AI can already be made by the artists and labels based on available data. 

At Cyanite, we provide our API for access to data and the development of any kind of intelligence engines. As always, at each level of the pyramid, the quality of data plays a vital role. Cyanite generates data about each music track such as bpm, dominant key, predominant voice gender, voice presence profile, genre, mood, energy level, emotional profile, energy dynamics, emotional dynamics, instruments, and more.

Cyanite Library view

Each parameter is provided with its respective weight across the duration of the track. Based on different audio parameters, the system determines the similarity between the items and lists similar songs based on a reference track. These capabilities can be used for the development of intelligent products and tools as well as making intelligent decisions based on data within the company.

I want to analyze my music data with Cyanite – how can I get started?

Please contact us with any questions about our Cyanite AI via mail@cyanite.ai. You can also directly book a web session with Cyanite co-founder Markus here.

If you want to get the first grip on Cyanite’s technology, you can also register for our free web app to analyze music and try similarity searches without any coding needed.

Free Data Sheet: Full Tagging Analysis of Spotify’s New Music Friday

Free Data Sheet: Full Tagging Analysis of Spotify’s New Music Friday

This analysis example gives you a comprehensive overview of Cyanite’s auto-tagging scope. Whether you are thinking about integrating Cyanite into to your platform or just want to get a general idea of AI tagging in action, this data sheet is for you!

To show you how it works, we analyzed the New Music Friday playlist by Spotify (Germany). To get the data sheet, leave your email here.


Benchmarking in the Music Industry – Knowledge Layer of the Data Pyramid

Benchmarking in the Music Industry – Knowledge Layer of the Data Pyramid

This article is a continuation of the series on the Data Pyramid which allows to turn music data into actionable insights. In this part of the series, we review the third step of the Data Pyramid – Knowledge. For details on all articles in the series, see below: 

How to Turn Music Data into Actionable Insights: This article is the first one in the series. It reviews all layers of the Data Pyramid and shows how to turn raw data into actionable insights. 

An Overview of Data in The Music Industry: This article presents all types of metadata in the industry from factual (objective) metadata to performance metadata. It is an essential guide for music professionals to understand all the various data sources available for analysis. 

Making Sense of Music Data – Data Visualizations: This article discusses the second step of the Data Pyramid – Information and how information can be presented in the form of data visualizations, making it easier to comprehend large data sets. 

Data Pyramid and the Knowledge Layer
Once you collect the data and analyze it to get information (organized, structured, and visualized data), it can then be turned into knowledge. Knowledge puts information into context. This context can be KPI’s after a significant change or performance against the competition.

At this step, attempts to look into the future and predict outcomes are made. The more specific the problem or context you’re observing is, the more precise your findings will be at this step. The Knowledge Layer produces analytics that help benchmark performance. As Liv Buli from Berklee Online University puts it, at the Knowledge layer you can tell that the artist of a certain size sells well after performing on the TV show and use this information to guide strategy for other artists of the same size. As a result, knowledge makes it possible to look at data in the industry-specific context and understand how you compare in relation to past successes and to competition. In that regard, benchmarking and setting expectations is the final outcome of the knowledge step. 

Benchmarking can take different forms within the music industry: 

Types of benchmarking 


  • Process benchmarking

This type of benchmarking deals with processes and aims to optimize internal and external processes in the company. You can improve the process by looking at what competitors are doing or setting one process against another. Processes relate to how things are done in the company, for example, the process of uploading songs to the catalog. 

  • Strategic benchmarking

Strategic benchmarking focuses on the business’s best practices which is often more complex than the other two types of benchmarking and includes: competitive priorities, organizational strengths, and managerial priorities. For example, an assessment of how fans responded to the brand sound in the past can help devise a long-term sound branding strategy.

  • Performance benchmarking

Performance benchmarking compares product lines, marketing, and sales figures to determine how to increase revenues. For example, as a marketing campaign for a music release develops over time, it can reveal the most vital money channels for exposure. Sales figures can indicate how artists compare to one another in terms of profitability. 

The Music Industry Benchmarks
In this part of the article, we review some of the various ways you can derive knowledge from data and how this knowledge can be used for benchmarking. This list is not final as there are many types of data in the music industry that can be analyzed and turned into knowledge.

1. Analyzing hit songs and popular artists to discover new talent

You can utilize Cyanite’s technology to analyze what’s currently working in the music industry in different markets. In particular, you can analyze popular songs and understand what makes them successful in terms of audio-based features such as genre, mood, energy level, etc. Further, you can use the Similarity Search to find tracks with a similar vibe and feel. It then helps you discover and identify new talent which may go along the same lines as current successes. Of course, that is not the whole story of making a hit but it gives you a pretty solid foundation of hitting the current zeitgeist.  

Cyanite Similarity Search interface

2. Analyzing popular playlists to predict matches

We specifically described this use case in The 3 Best Ways to Improve your Playlist Pitching with CYANITE article. You can analyze existing popular playlists such as Spotify New Music Friday or Spotify Peaceful Piano and see what songs are usually featured. This information can then help to understand the profile of the playlist which allows you to find the perfect fit and increase the chances of getting into the playlist. It also supports you in describing the songs to the editors in the way that song is accepted.  

Algorithmic performance increasingly determines whether or not strangers hear my song. More strangers hearing my songs is how my fanbase grows—and that cannot happen unless I understand how algorithms are likely to analyze and classify my song by genre, mood, and other relevant characteristics.
Brick Blair

Independent singer-songwriter, brick@brickblair.com, @brickblair

Photo at Unsplash @heidijfin

3. Analyzing marketing and sales numbers to allocate marketing budgets and support event planning

For example, record labels can analyze the performance of their artists and adjust marketing campaigns accordingly. Insight can help change the direction of the marketing campaign, choose appropriate channels, and allocate marketing budgets more effectively. In events planning, you can analyze event venues and identify the most relevant cities and venues based on past events. 

4. Analyzing the artists’ styles to identify opportunities for song-plugging

If you’re a music publisher looking to get a placement on a new release of a successful artist, analyzing their previous style and matching it to your catalog of demos would be the way to go. 

In this case, some audio qualities of the song are not important, as it will be eventually re-recorded. To analyze songs, a regular Cyanite functionality can be used including the Keyword Search by Weights where you can search your demo-catalog by the analysis results of the successful artist on weight-specific keywords to get the most relevant results. 

5. Analyzing fan engagement to identify audience segments

You can also analyze artists’ performance by looking into fan engagement on social media and music platforms. Through understanding the fan’s demographics, interests, and lives, you can create custom audiences for new artists or deepen fan engagement for the same artist based on past campaigns. This use case has been thoroughly described in the article How to Create Custom Audiences for Pre-Release Music Campaigns in Facebook, Instagram, and Google.

Photo at Unsplash @luukski

6. Analyzing trending music in advertising to find the most syncable tracks in the own catalog.

Sync licensing which includes finding the sync opportunities and pitching specific songs can benefit from data analysis and benchmarking. Trending music in brand advertising can be analyzed to reveal the brand’s sound. This sound will then be matched to specific songs in your catalog making a strong case in the pitch to the brand in terms of sound-brand-fit. If you are interested in this use case and how data can be used in sound branding and sync licensing check out the interview we did with Vincent Raciti from TRO – About AI in sound branding.

Potential Issues and Questions
– Finding reliable data, specifying the problem/context and analyzing information can be difficult. Deriving knowledge and benchmarking involves first asking a specific question or making a specific hypothesis and then getting a proper set of data to answer/verify it. If the data set is faulty, the knowledge will be wrong and potentially even harmful to your business outcome. Additionally, at this stage of the Data Pyramid, it is easy to ignore the previous steps and not explore the deeper layers of data missing out on the details.

Knowledge is about the past, not the future. At the knowledge layer, you only have information about what happened before. Usually, information about the present (though some tools provide access to real-time data) or the future is not taken into account. It is important to remember this limitation as past performance is no guarantee to future results.

Conclusion
Raw data is usually useless unless organized and interpreted. Only then does data become information. But before that, decisions on types of metadata and the methods to extract data have to be made. This process of data accumulation and filtering can be very time-consuming. 

At the stage of Information, data is structured and organized so it can be interpreted. Information requires less time to find relevant data but there is still a lot of effort involved. 

At the Knowledge level, information is put into context and can be used for benchmarking and setting expectations. This context can be historical and involve past successes or it can relate to the position of others in the market. What kind of knowledge is derived from information depends on the initial data set and on the ability to store the memories of past successes. This process of turning data into knowledge takes a whole new form when machine learning and deep learning techniques are used as they significantly speed up the process of data collection and can memorize tons of data. However, a lot of knowledge in the music industry is still derived manually by looking at the past outcomes and trying to apply them somehow in the present.  

I want to analyze my music data with Cyanite – how can I get started?

Please contact us with any questions about our Cyanite AI via mail@cyanite.ai. You can also directly book a web session with Cyanite co-founder Markus here.

If you want to get the first grip on Cyanite’s technology, you can also register for our free web app to analyze music and try similarity searches without any coding needed.

Making Sense of Music Data – Data Visualizations

Making Sense of Music Data – Data Visualizations

1This article is a continuation of the series “How to Turn Music Data into Actionable Insights”. We will explore the second step of the Data Pyramid – Information and Visualizations. For details on the first step – Data – you can see the article here.

Making Sense of Music Data

The Information stage of the Data Pyramid involves organizing and visualizing data. Organizing is often done with the use of business intelligence, while visualizations are presented in the form of pie charts, line graphs, tables, etc. This stage of the pyramid answers the question “What happened?” (or What is happening?) in the business. 

Data becomes information when it is structured and organized. Some think that organizing and structuring data is not enough and only when data is useful and meaningful then it can be considered information. To combine these two views, we will consider that data becomes information when it is structured and meaningful. The final goal of the information stage is to come up with data visualizations that combine data and information so that conclusions can be made.

Music Data Visualizations

Data visualization is the process of translating large data sets and metrics into charts, graphs, and other visuals. Visualizations combine both design and computing skills. There is also psychology involved in how people read and interpret visuals.  

So data visualizations pursue several goals: to communicate information effectively and to present the information in a visually appealing way. Some people even say that data should look sexy and an ideal visualization should stimulate viewer engagement. A great example of this is the work by the London-based Italian information designer Tiziana Alocci who uses visualizations for many different use cases: album covers, corporate visualizations, and editorial infographics.


Data-driven album cover by Tiziana Alocci, 2019.

EGOT Club, by Tiziana Alocci for La Lettura, Corriere della Sera, 2019.

As an information designer, my job is to visualize data and represent information visually. My most traditional data visualization works involve the design of insight dashboards, thought-provoking data visualizations, and immersive data experiences. For me, the entire process of researching, sorting, organising, connecting, feeling, shaping, and acting is the highest form of human representation through data.

See Tiziana’s works on Instagram. 

Tiziana Alocci

Information Designer and Art Director at Tiziana Alocci Ltd, Associate Lecturer at University of the Arts London

Data visualizations that are used for business decisions are usually expected to be visually appealing and clear and communicate information. So design, data science, and computing knowledge should really work together to create effective data visualizations. 

Data Visualization Tools

Before data can be analyzed and visualized it is important to decide which data to use as well as ensure the quality of data. For different types of metadata used in the music industry, see the article here. Once the dataset is chosen and analyzed, it can then be visualized either with the help of a designer or using one of the three types of Music Data Visualization Tools:

1. Music Analysis and Discovery Tools

These tools show major characteristics of music such as genre, mood, emotional profile, energy level, etc., as well as show relations between artists and tracks. The idea is that similar tracks can be analyzed in detail and combined into playlists or recommended to customers. Cyanite usually falls into this category of music data visualization tools. 

2. Music Visualization Tools for Researchers

These tools are used for research purposes to prove a thesis or provide an overview of the field. For example, Ishkur’s Guide to Electronic Music was originally created as a genealogy of electronic music over the course of 80 years. It consists of 153 subgenres and 818 sound files

3. Marketing Tools

These tools present data visualizations that can be used for sales, advertising, and marketing purposes. They visualize data about consumer preferences, artists’ popularity, track consumption, industry trends, etc. which is not audio sound data. 

An example of marketing visualization tools could be web applications such as Pandora AMP and Soundcharts that provide data and visualizations to derive information. Tools like Tableau and Plot.ly allow you to upload raw data and get industry reports. 

Data Visualization Techniques

The general visualization techniques to help represent data in an effective way are trend charts, comparison charts, pie charts, connections, maps, etc. These can be constructed manually or by the computer.

For example, spectrograms are used by Cyanite to train the computer to identify patterns in the audio sounds.

Spectrograms used by Cyanite from left to right: Christina Aguilera, Fleetwood Mac, Pantera

Cyanite’s moods are presented in a comparison chart where overarching mood and the least present mood can be easily identified.

Comparison chart in Cyanite mood analysis project

Genre is represented in a trend chart that shows how track’s mean value of genre changes throughout the duration of the track. 

Genre trend chart in Cyanite detail view

In this project, representing the history of rock, a connection chart shows how different artists relate to each other in a linear or hierarchical way. 

To learn more about data visualization techniques see the article here. 

Examples from the World of Sound Branding

We asked companies specializing in data analysis and visualization how data visualizations are used in their work. 

AMP Sound Branding works with data visualization experts and depending on where the company plans on using the data, they visualize it in different ways. 

We try to use whatever technique that fits the data and the story we are telling best. Often we use Polar Area charts and spider-graphs as we find them a good fit for the Cyanite data.

Bjorn Thorleifsson

Head of Strategy & Research at amp sound branding

In the research on automotive industry sound, for example,  AMP used a combination of Polar area charts and line charts to visualize brand moods and compare.

Hyundai Genre by AMP

Overall Moods by AMP

At TAMBR sonic branding, a big chunk of work is to create a shared understanding of musical parameters that surround a brand. 

They say music is a universal language, but more often than not, talking about music is like dancing about architecture. As such, we only start composing once we have agreed on a solid sonic moodboard. For this to happen, we always start with a Cyanite-powered music search based on the brand associations of our client. For each track we present, we also visualize how it scores on the required associations.

Niels de Jong

Sonic strategist at TAMBR Sonic Branding

TAMBR visualizations take some of the subjectivity away when choosing the right music for a brand. However, these visualizations are merely guidelines, not strict pointers. According to the company, magic happens where data and creativity meet.

Data Visualizations by TAMBR
Conclusion

Data visualizations are a powerful way to present the results of data analysis and gain additional insights. Visualizations can really improve the process of decision-making. They can also be used on their own in the sales process to impress customers. 

However, this stage of the Data Pyramid is also connected to a range of problems. For example, misinterpretations often occur when the output is interpreted as the only truth, disregarding the input dataset and its limitations. Sometimes people rely on visuals so much that they don’t go into exploring the deeper layers of data, missing out on the important information. The human element in algorithms is also a problem. In some algorithms, a human marks the data as important to consider for a machine, so this affects how the algorithm learns and develops. Nevertheless, data visualizations are widely used to present some version of the truth in a clean and digestible format. 

You really can’t ignore the simplicity of data visualizations and their ability to navigate the viewer’s attention to the key information. Yet, to get a simple graph, tons of data mining and data analysis work is usually required. 

I am interested to visualize my music data with the help of Cyanite – how can I get started?

Please contact us with any questions about our Cyanite AI via sales@cyanite.ai. You can also directly book a web session with Cyanite co-founder Markus here.

If you want to get the first grip on Cyanite’s technology, you can also register for our free web app to analyze music and try similarity searches without any coding needed.

An Overview of Data in The Music Industry

An Overview of Data in The Music Industry

This article is a continuation of the series “How to Turn Music Data into Actionable Insights”. We’re diving deeper into the first layer of the Data Pyramid and explore different kinds of metadata in the industry. 

Metadata represents a form of knowledge in the music industry. Any information you have about a song is considered metadata – information about performance, sound, ownership, culture, etc. Metadata is already used in every step of the value chain; for music recommendation (algorithms), release planning, advance payments, marketing budgeting, royalty payouts, artist collaborations, and etc. 

Nonetheless, the music industry has an ambivalent relationship with musical metadata. On the one hand, the data is necessary as millions of songs are circulating in the industry every day. On the other hand, music is quite varied and individual (pop music is very different to ambient sounds, for example) so the metadata that describes music can take different forms and meanings making it a quite complex field. 

This article intends to explore all kinds of metadata used in the industry from basic descriptions of acoustic properties to company proprietary data. 

The article was created with helpful input from Music Tomorrow:

Music data is a multi-faceted thing. The real challenge for any music business looking to turn data into powerful insights is connecting the dots across all the various types of music data and aggregating it at the right level. This process starts with figuring out how the ideal dataset would look like — and a well-rounded understanding of all the various data sources available on the market is key

Dmitry Pastukhov

Analyst at Music Tomorrow

Types of Metadata

There are various classifications of the music metadata. The basic classification is Public vs Private metadata: 

  • Public metadata is easily available and visible to the public.  
  • Private metadata is kept behind closed doors due to legal and security or because of economic reasons. Maintaining competitiveness is one of these reasons why the metadata is kept private. Typically, performance-related metadata like sales numbers is private. 

Another very basic classification of metadata is Manual vs Automatic annotations: 

  • Manual metadata is entered into the system by humans. These could be annotations from the editors or users. 
  • Automatic metadata is obtained through automatic systems, for example, AI.

1. Factual (Objective)

Factual metadata is objective. This is such metadata as artist, album, year of publication, and duration of the song, etc. Factual metadata is usually assigned by the editor or administrator and describes the information that is historically true and can not be contested. 

Usually, factual metadata doesn’t describe the acoustic features of the song. 

Besides the big streaming services, platforms like Discogs are great sources to find and double-check objective metadata. 

Discogs provides a full account of factual metadata

2. Descriptive (Subjective)

Descriptive metadata (often also referred to as creative metadata or subjective metadata) provides information about the acoustic qualities and artistic nature of a song. These are such data as mood, energy, and genre, voice, and etc.  

Descriptive metadata is usually subjectively defined by the human or the machine based on the previous experience or dataset. However, BPM, Key, and Time Signature are the exception to this rule. BPM, Key, and Time Signature are objective metadata that describe the nature of the song. We still count them as the descriptive metadata.  

Major platforms like Spotify and Apple Music have strict requirements for submitted files. Having incomplete metadata can result in a file being rejected for further distribution. For music libraries, the main concern is user search experience as categorization and organization of songs in the library rely almost entirely on metadata.

Companies such as Cyanite, Musiio, Musimap, or FeedForward are able to extract descriptive metadata from the audio file.

3. Ownership/Performing Rights Metadata

Ownership Metadata defines the people or entities who own the rights to the track. These could be artists, songwriters, labels, producers, and others. These are all sides interested in a royalty split, so ownership metadata ensures everyone involved is getting paid. Allocation of royalties can be quite complicated with multiple songwriters involved, songs using samples of other songs, and etc. So ownership metadata is important.

Companies such as Blòkur, Jaxta, Exectuals, Trqk, and Verifi Media provide access to ownership metadata with the goal to manage and track changes to ownership rights of the song over time – and ensure correct payouts for the rights holders.

4. Performance – Cultural Metadata

The performance or cultural metadata is produced by the environment or culture. Usually, this implies users having an interaction with the song. This interaction is then registered in the system and analyzed for patterns, categories, and associations. Such metadata includes likes, ratings, social media plays, streaming performance, chart positions, and etc. 

The performance category can be divided into two parts: 

  • Consumption or Sales data deals with consumption and use of the item/track and usually needs to be acquired from partners. For example, Spotify shares data with distributors, distributors pass it down to labels, and so forth. 
  • Social or Audience data. Social data indicates how well music/artist does within a particular platform plus who the audience is. It can be accessed either through first-party tools or third-party tools. 

First-party tools are powerful but disconnected. They require to harmonize data from different platforms to get a full picture. They are also limited in scope, meaning that they cover only proprietary data. Third-party tools are more useful. They provide access to data across the market, incl. performance for artists you have to connect to. In this case, the data is already harmonized but the level of detail is lower. 

Another way to acquire social data is tracking solutions (movie syncs, radio, etc) that produce somewhat original data — these could be either integrated with third-party solutions (radio-tracking on Soundcharts/Chartmetric, for example) or operate as standalone tools (radio monitor, WARM, BDS tracker). It is still the consumption data but it’s accessed bypassing the entire data chain.

5. Proprietary Metadata

Proprietary data is the data that remains in the hands of the company and rarely gets disclosed. Some data used by recommender systems is proprietary data. For example, a song’s similarity score is proprietary data that can be based on performance data. This type of data also includes insights from ad campaigns, sales, merch, ticketing, and etc. 

Some of the proprietary data belongs to more than one company. Sales, merch, ticket sales — a number of parties are usually involved here.

Outlook

Today, processes in the music industry are rather one-dimensional when it comes to data. For instance, marketing budgets are often planned merely based on past performance of an artist’s recordings – so are multiples on the acquisitions of their rights. 

Let’s look at the financial sector: In order to estimate the value of a company, one has to look at company-internal factors such as inventory, assets, or human resources as well as outside factors such as past performances, political situation, or market trends. Here we look at proprietary data (company assets), semi-proprietary data (performance), and public data (market trends). The art of connecting those to make accurate predictions will be the topic of future research on the Cyanite blog.

Cyanite library provides a range of descriptive metadata

Conclusion

Musical metadata is needed to manage large music libraries. We tried to review all metadata types in the industry, but these types can intersect and produce new kinds of metadata. This metadata can then be used to derive information, build knowledge, and deliver business insights, which constitute the layers of the Data Pyramid – a framework we presented earlier that helps make data-based decisions. 

In 2021, every company should see itself as a data company. Future success is inherently dependent on how well you can connect your various data sources.

I want to integrate AI in my service as well – how can I get started?

Please contact us with any questions about our Cyanite AI via sales@cyanite.ai. You can also directly book a web session with Cyanite co-founder Markus here.

If you want to get the first grip on Cyanite’s technology, you can also register for our free web app to analyze music and try similarity searches without any coding needed.

How to Turn Music Data into Actionable Insights

How to Turn Music Data into Actionable Insights

Decisions in the music industry are increasingly made based on data. Services like Chartmetric, Spotify for Artists, or Facebook Business Manager among others are powerful tools to enable music industry teams to back up their work with data. This process of collective data generation is called datafication, pointing at the fact that almost everything nowadays can be collected, measured, and captured either manually or digitally. Data can be used by recommendation algorithms to recommend music. This data is also an opportunity for the stakeholders to make business decisions, reach new audiences in the market, and find innovative ways to do business. 

However, decision-making from data also requires a new level of analytical skills. Simple statistical analysis is not enough for data-based decision-making. The amount of data, its complexity, and challenges associated with storing and synchronizing large data require smart technologies to help manage the data and make use of it. 

This article explains the general framework for data-based decision-making and explores how Cyanite capabilities can lead to actionable business insights. It is specifically tailored to music publishers, music labels, and all types of music businesses that own musical assets. This framework can be applied in a variety of ways to areas such as catalog acquisitions, playlist pitching, and release plans.

Data Pyramid

So how are data-based decisions made? The framework for decision-making is based on the Berklee University Data Pyramid model by Liv Buli. In the next parts we outline the 4 steps of the model and add a certain Cyanite layer to it:

  1. Data Layer
  2. Information Layer
  3. Knowledge Layer 
  4. Intelligence Layer

1. Data Layer

At the very first layer, the raw data is generated and collected. This data includes user activity, information about the artist such as social media accounts and usernames, album release dates or concert dates, and creative metadata. Among others, a technology like Cyanite generates creative metadata such as genre, mood, instruments, bpm, key, vocals, and more.  

At this stage the data is collected in a raw form, so limited insights can be made out of it. This step is, however, crucial for insight generation at the next layers of the pyramid. 

It’s also important to remember a general rule of thumb: the better the input, the better the output. That is, the higher the quality of this initial data generation, the better insights you can derive from it at the top of the pyramid. Any mistakes made in the crucial data layer will be carried in the other layers biasing insights and limiting actionability.

Our philosophy at Cyanite is to have a  reduced set of data output in the first layer to help accuracy and reliability. The data is presented in readable form in the Cyanite interface. You can see what kind of data Cyanite generates in this analysis of Spotify’s New Music Friday Playlist. 

Cyanite Interface

2. Information Layer

At the information level, the data is structured and visualized, often in a graphical form. A first glance at data in a visual form can already bring value and enable the company to answer questions such as: “What happened with the artist, playlist, or a chart?” 

At each stage of the pyramid, an appropriate analytical method is used. The visualization and reporting methods among others at the information stage are called descriptive analytics. The main goal at this stage is to identify useful patterns and correlations that can be later used for business decisions. 

Analytical methods used at each stage of the data pyramid

(based on Sivarajah et al. classification of data analytical models, 2016)

At this level, there are two main techniques: data aggregation and data mining. Data aggregation deals with collecting and organizing large data sets. Data mining discovers patterns and trends and presents the data in a visual or another understandable format. 

This is the simplest level of data analysis where only cursory conclusions can be made. Inferences and predictions are not made on this level. 

Instruments in Detail View

One of many ways to visualize music via Cyanite’s detail view

3. Knowledge Layer

The knowledge layer is the stage where the information is converted into knowledge. Benchmarking and setting milestones are used at this stage to derive insights from data. For example, you can set expectations for the artist’s performance based on the information about how they performed in the past. Various activities such as events and show appearances can influence the artist’s performance and this information too can be converted into knowledge, indicating how different factors affect the artist’s success. 

This stage employs the so-called predictive analytics that answer the question: “What is likely to happen in the future?” This kind of analytics captures patterns and relationships in data. They can also deal with historical patterns, connect them to future outcomes, and capture interdependencies between variables. 

At the knowledge level, such techniques as data mining, statistical modeling, and machine learning algorithms are used. For example, machine learning methods can try to fill in the missing data with the best possible guesses based on the existing data. More information on the techniques and advantages and disadvantages of each analytical method can be found here. 

Here are some contexts in which the data generated by Cyanite could create knowledge:

  • Analyzing a “to-be-acquired” catalog of music rights and benchmarking it into the existing one;
  • Analyzing popular playlists to predict matches;
  • Analyzing trending music in advertising to find the most syncable tracks in the own catalog.

4. Intelligence Layer

The intelligence layer is the stage where questions such as “So What?” and “Now What?” are asked and possibly answered. This level enables the stakeholders to predict the outcomes and recommend actions with a high level of confidence. However, decision-making at this level is risky as the wrong prediction can be expensive. While this level is still very much human-operated, machines, especially AI, are moving up the pyramid levels to take over insights generation and decision making. 

Prescriptive analytics deal with cause-effect relationships among knowledge points. They allow businesses to determine actions and assess their impact based on feedback produced by predictive analytics at the knowledge level. This is the level where the truly actionable insights that can affect business development are born. 

Intelligence anticipates what and when something might happen. It can even attempt to understand why something might happen. At the intelligence level, each possible decision option is evaluated so that stakeholders can take advantage of future opportunities or avoid risks. Essentially, this level deals with multiple futures and evaluates the advantages of each option in terms of future opportunities and risks. For further reading, we recommend this article from Google revealing the mindset you need to develop data into business insights.  

Cyanite and Data-Based Decision

At the very base of the Data Pyramid lies raw data. The quality and accuracy of raw data is detrimental in decision making. 

Cyanite generates data about each music track such as bpm, dominant key, predominant voice gender, voice presence profile, genre, mood, energy level, emotional profile, energy dynamics, emotional dynamics, instruments, musical era, and other characteristics of the song. This data is then presented in a visual format such as graphs with dynamic and the ability to choose the custom segment.

Based on different audio parameters, the system determines the similarity between the items, and lists similar songs based on a reference track. From Cyanite analytics, it can be derived, for example, what the overall mood of the library is and different songs can be added to make the library more comprehensive. Branding decisions can also be made using Cyanite, to ensure all music employed by the brand adheres to one mood or theme. 

I want to integrate AI in my service as well – how can I get started?

Please contact us with any questions about our Cyanite AI via sales@cyanite.ai. You can also directly book a web session with Cyanite co-founder Markus here.

If you want to get the first grip on Cyanite’s technology, you can also register for our free web app to analyze music and try similarity searches without any coding needed.